
Air pollution is a major challenge for public health in Asia countries, especially in China and India. It has been well known that air pollution is particularly serious in winter, when the need or demand for energy supply increases because many people rely on fossil fuels (coal, oil and natural gas) or biomass burning to keep warming.
Numerous reports have documented various air pollution episodes in different Asia countries. Recently, I have overviewed seasonal air pollution in winter in Asia countries in the posts enclosed. In order to fully understand the dynamics of air pollution in Asia, it may be interesting and necessary to overview the air pollution in the continent of Asia in spring.
The starting date of spring varies in different Asia countries because of heterogeneity of local climates, cultures and customs. In some countries (e.g., India, Turkey) spring months generally include March, April and May, while in some other countries (e.g., China) spring begins in early February and continues until early May.
Thus, this post aimed to conduct a brief overview of air pollution across Asia in March and April 2018, since it is a spring time shared in almost all Asia countries. The Real-Time Map of Air Pollution displayed at the US-based non-profit Berkeley Earth website was used to demonstrate air-pollution patterns and trends. Such effort may also be helpful for people to decide when and where to have their spring visits in next years.
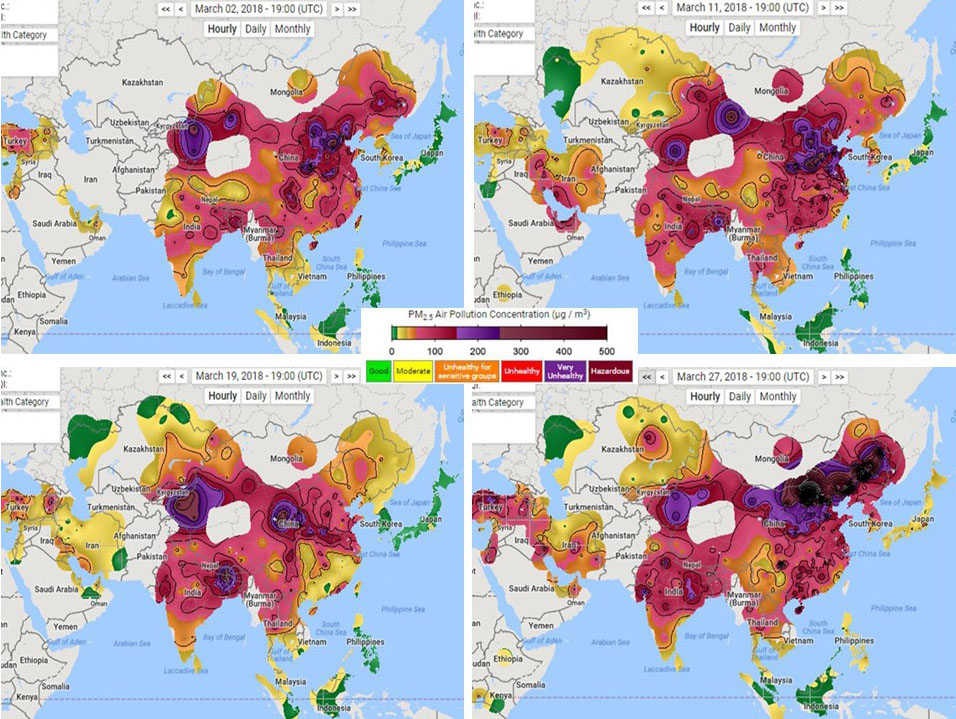
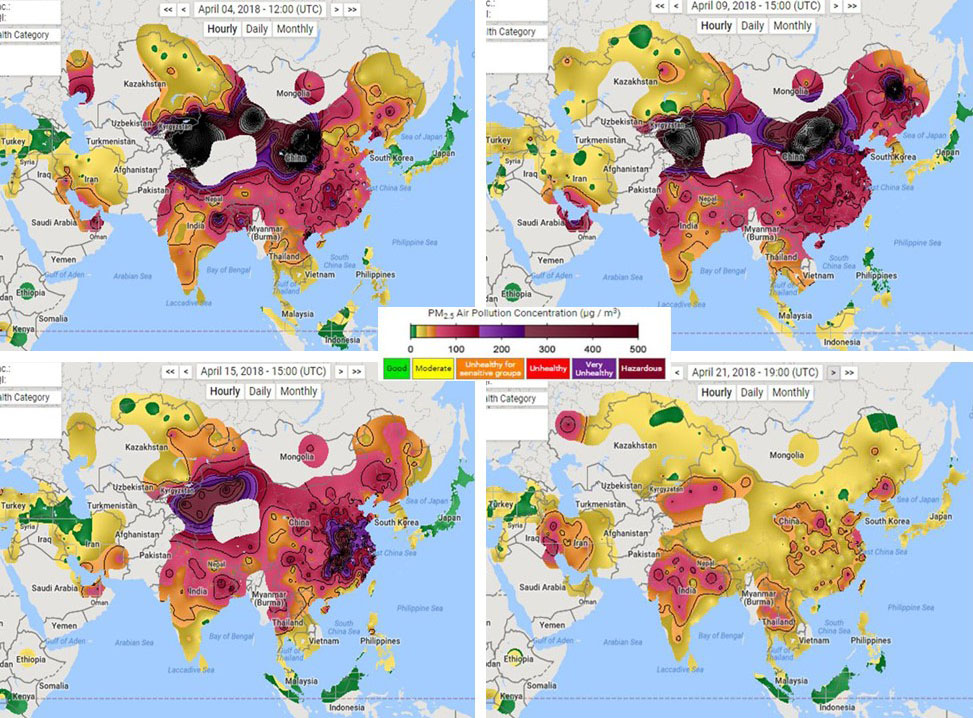
Overall, as shown on the Real-Time Map of Air Pollution, different levels of air pollution were persistently evident across inland countries in the continent of Asia (such as China, Mongolia, India and Iran), and frequently presented in island countries in Asia, including Malaysia, Indonesia, Philippines and Japan, during March and April 2018. With the available data, air quality was particularly worse in China, followed by Mongolia, India, Turkey, Iran, Thailand and Vietnam. In the late April, air quality was improved in most areas of the continent of Asia.
Specifically, toxic air pollution was persistently evident across China in March 2018. During this month, an orange smog alert – the second-highest in a four-level system after red – was declared twice in more than 30 cities in northern China (from March 12 to 14 and from March 25 to 27, respectively). On March 27, many areas in northern China were hit by the year’s first severe sand storm attributable to land deterioration and desertification coupled with climate change. It can be noted on the Real-Time Map of Air Pollution that dust and sand covered an area of around 1.5 million square kilometers in northern China and lasted for days.
In April 2018, sandstorms continued to smother northern China and the Chinese Capital in dust. The sandstorm episodes were particularly severe on April 4 and April 9, respectively. Air pollution levels in Beijing and some other areas were so high they went off the Air Quality Index system scale. It was reported that many areas recorded a PM10 density higher than 2,000 micrograms per cubic metre of air. In total, hazardous air pollution attributable to the sandstorms persisted for more than 20 days in northern China, from March 27 to April 19. The heavy air pollutants were also floated to southeast China. Since April 21, air quality was much improved across China, possibly due to seasonal winds, temperature increase and decreased demands for coal-powered energy. In many areas, PM2.5 density became lower than 100 ug/m3.
In Mongolia, the severity levels of air pollution were always consistent with that in Northern China during the period.
It was surprisingly noted that air-pollution data from Kazakhstan have been added onto the Real-Time Map of Air Pollution since March 11, 2018, which will be useful and helpful to advance our understanding of air pollution in Central Asia. Over the past two months, mild to moderate levels of air pollution were persistently evident across Kazakhstan. Very often, air quality in Eastern Kazakhstan became much worse because of cross-border air pollutants floated from Western China.
For Iran, the data of air pollution over the whole country have also been added onto the Real-Time Map of Air Pollution since March 11, 2018. Over the past two months, harmful air pollution patterns were persistently or frequently visible in many areas across Iran. The severity levels of air pollution seemed to be comparable to that in Turkey, where PM2.5 concentrations persistently fluctuated around 100 ug/m3, but lower than that in India.
In India, air pollution seemed to be improved slightly in spring in northern areas, compared to that in the last winter. Harmful air pollution patterns were still persistently visible in early spring in most areas, especially in northern India. In the late April, air pollution in India seemed to be further improved, but not as significantly as that in China. As shown on the Real-Time Map of Air Pollution, PM2.5 concentrations in India became higher than that in most areas of China for the first time in the year.
In Thailand, Vietnam and Korea, mild to moderate levels of air pollution were also frequently evident in spring, possible due to mixed air pollutant emissions generated both locally and regionally.
For island countries in Asia, including Malaysia, Indonesia, Philippines and Japan, air pollution patterns varied from time to time in spring, depending on seasonal winds and the amount of air pollutants floated from the continent of Asia. As I have addressed in a previous post, the real-time air pollution index is not a sensitive indicator to air pollutant emissions in these countries.
In summary, air pollution is still a major concern across the continent of Asia in early and middle spring and is not improved until late April.
Related Posts:
Seasonally Persistent and Hazardous Air Pollution in Asia
Bi-weekly Review of Air Pollution in Asia

Leave a Reply