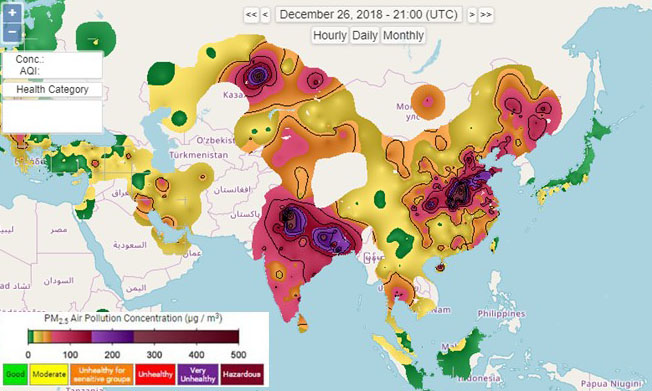
(Air pollution in Asia on 26 December 2018. Source: Berkeley Earth)
In recent years, air pollution has become a serious concern in Asia countries, especially in China and India. It is particularly horrendous in some areas such as northern China during the cold winter season because of a huge amount of needs for energy supply. People in Asia mainly rely on coal to keep heating and warming. Consequently, air pollutant emissions increase each day in a huge amount, resulting in heave smog or hazardous air pollution over a wide range of areas from time to time, especially when the wind doesn’t blow.
Air Quality Index (AQI) is an indicator that has been popularly used to access how polluted the air currently is. As shown on the Real-time Map of Air Pollution that is based on AQI and hosted at the non-profit Berkeley Earth website, air pollution is particularly serious in four areas in Asia: north-central China, northern India, central Asia including Kazakhstan and part of Xinjiang District, and the Middle East area surrounding the Persian Gulf. Very often, air pollution is at hazardous or deadliest levels in these areas and persistent for a period of a few days or weeks, while mild to moderate levels of air pollution are evident almost all year round there. Such a persistent exposure to hazardous air pollution is of particular risk for human health.
AQI, mainly measured by PM2.5, and the Real-time Map of Air Pollution are excellent in displaying the severity levels of air pollution in different areas. However, they are not sensitive in displaying the real scale or true range of air pollution at regional level since relevant data are not available for some areas. They are also not sensitive in estimating the total amount of air pollutants emitted or the total amount of carbon burned in different areas. Moreover, the density of PM2.5 highly depends on the nature, in addition to the amount, of fossil fuels burned.
Fossil CO2 emissions are a sensitive indicator to measure the total amount of carbon burned in different areas, though they are not a sensitive indicator to air pollution. Usually, high levels of fossil CO2 emissions may indicate high levels of other harmful air pollutants. If we know the percentage and amount of different fossil fuels burned in a particular area, the real scale of air pollution or the total amount of air pollutants emitted in that area may be estimated or calculated using the amount of fossil CO2 emissions. More importantly, the amount of fossil CO2 emission is highly associated with climate warming.
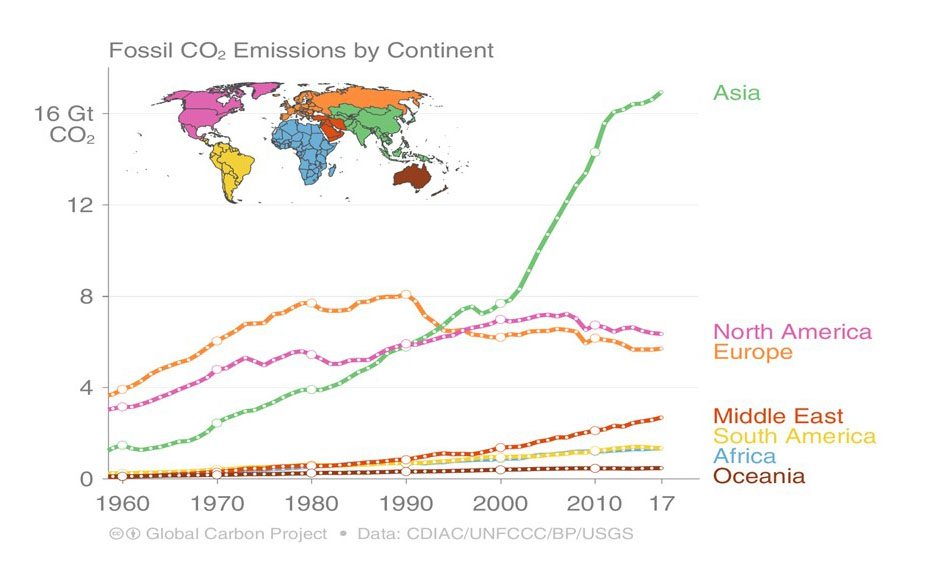
Annual fossil CO2 emissions by continent (Le Quere et al. 2018, ESSD; Jackson et al. 2018, ERL) Global Carbon ProjectFossil CO2 emissions by continent in 2017
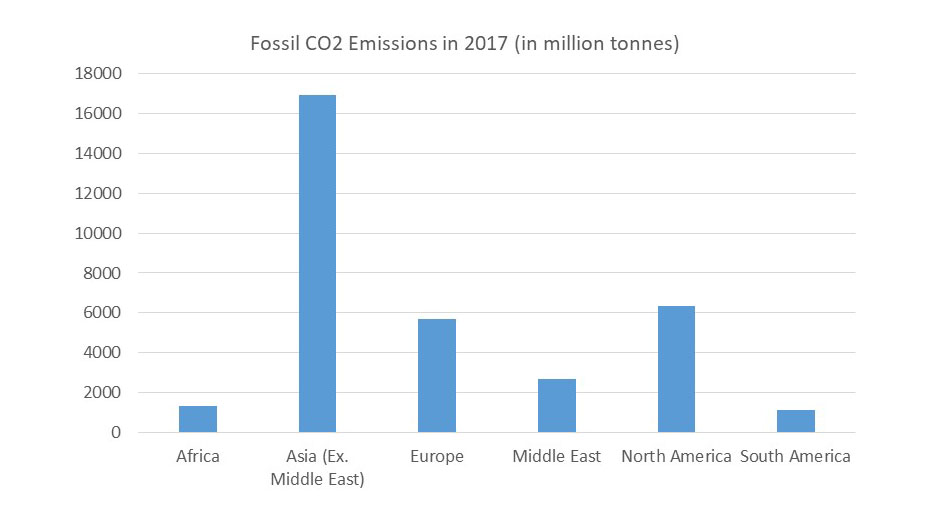
Over the past 150 years, cumulative CO2 emissions in the atmosphere have increased by 40%, primarily through the combustion of fossil fuels. On 5 December 2018, the Global Carbon Project team released a report at the UN climate summit in Poland, projecting that global CO2 emissions would jump to a record high in 2018. The report indicates that Asia has dominated global CO2 emissions since 2000. According to the report, the total amount of fossil CO2 emissions in Asia (including the Middle East) were 19.6 billion tonnes in 2017, accounting for 54.2% of global CO2 emissions (36.1 billion tonnes).
The following table displays fossil CO2 emissions in major nations or areas in Asia in 2017. As shown, China, India and Japan are the top three Asia nations with the largest amount of fossil CO2 emissions. Specially, fossil CO2 emissions from China covered 27.2% (more than one-fourths) of global CO2 emissions in 2017, while fossil CO2 emissions from India and Japan in 2017 accounted for 6.8% and 3.3% of global CO2 emissions, respectively. In addition, fossil CO2 emissions from the Middle East covered 7.3% of global CO2 emissions in the year. According to the report, fossil CO2 emissions in China, India and Turkey increased most in 2017, compared with all other nations over the world. It is projected that fossil CO2 emissions will rise by 6.3% in India and 4.7% in China in 2018.
Table. Fossil CO2 emissions in major nations or areas of Asia in 2017
Nation or Territory
Total CO2 emissions
(million tonnes)
CO2 emissions per capita
(tonnes of CO2)
CO2 emissions per km2
(tonnes of CO2)
1. China
9838.8
6.98
1025.2
2. India
2466.8
1.84
750.3
3. Japan
1205.1
9.45
3189.4
4. Iran
672.3
8.28
408.0
5. Saudi Arabia
635.0
19.28
323.9
6. South Korea
616.1
12.08
6256.1
7. Indonesia
486.8
1.84
253.6
8. Turkey
447.9
5.55
573.8
9. Thailand
330.8
4.79
350.1
10. Kazakhstan
292.6
16.07
107.7
11. Taiwan
271.5
11.49
7502.1
12. Malaysia
254.6
8.05
772.0
13. United Arab Emirates
231.8
24.66
2796.5
14. Viet Nam
198.8
2.08
603.3
15. Pakistan
198.8
1.01
247.3
The Whole World
36153.3
4.79
270.1
Given different population sizes in different nations, it may be difficult to interpret or compare the total amount of fossil CO2 emission across different nations. Thus, it is important to take a look at the amount of fossil CO2 emission per capita. As shown in the table, the top three nations with the largest amount of CO2 emissions per capita in Asia in 2017 were United Arab Emirates, Saudi Arabia and Kazakhstan, where oil-production section is a major source of the country’s GDP. Although the amount of CO2 emissions per capita was much lower in India (1.84 tonnes) than in many other nations, the amount of fossil CO2 emissions per square kilometer in India in 2017 (750 tonnes) was significantly high, just slightly lower than the figure for China (1025 tonnes), which was a major mechanism underlying serious air pollution evident in India.
Therefore, looking at a nation’s total amount of fossil CO2 emissions and the amount of CO2 emissions per capita doesn’t tell the full story of a nation’s contribution to air pollution and climate warming. Given that each nation’s population size may vary each year, the amount of fossil CO2 emissions per square kilometer or mile, which is not addressed in the Global Carbon Project’s report, is an additional important indicator for comparisons. Based on the database released by the Global Carbon Project, I calculate the amount of fossil CO2 emissions per square kilometer for each nation or area and present the data for major nations or areas in Asia in the table.
As shown in the final column of the table, the top three nations or areas in the table with the largest amount of fossil CO2 emissions per square kilometer are Taiwan, South Korea and Japan (Singapore, Hong Kong and Qatar are not listed in the table for the limited amount of fossil CO2 emissions, though the amount of CO2 emissions per square kilometer is much higher there). However, air pollution as measured by PM2.5 in these areas is far less serious than that in northern China, possibly duo to that oil and gas rather than coal are a major source of energy in Taiwan, South Korea and Japan. Moreover, air pollutant emissions in these areas can be easily driven away by wind because all of them are island nations or areas. These reasons are also applicable to Malaysia where the amount of fossil CO2 emissions per square kilometer (772.0 tonnes) is slightly higher than that in India (750.3 tonnes) but air quality is always better.
In China, the average of fossil CO2 emissions per square kilometer is at a middle level, much lower than that in South Korea and Japan. However, dreadful air pollution is prevalent in China, especially in its northern areas surrounding Beijing, mainly due to that coal is a major source of energy there. If adjusted for barely populated regions and under-developed areas in China and taking seasonal variance into account, the amount of fossil CO2 emissions per square kilometer may be doubled or tripled in northern China in the winter season. In a very few nations such as Pakistan and Afghanistan (omitted in the table), both the amount of CO2 emissions per capita and the amount of CO2 emissions per square kilometer are quite low. However, it may not be possible for them to have good quality of air, as coal is also a major source of energy there. Most importantly, serious air pollution is almost always evident in its neighbor nations including China, India and Iran.
(China’s emissions are dominated by coal use. Source: Global Carbon Budget 2018)
Asia is the largest and most populous continent on the Earth. Its 4.5 billion people constitute roughly 60% of the world’s population. It covers an area of about 44.6 million square kilometers, about 30% of Earth’s total land area and 8.7% of the Earth’s total surface area. Air pollution and fossil CO2 emissions in Asia are so significant that definitely have great impact on global air quality and climate change. Currently, few populated areas in Asia are covered with the air that meet the WHO’s standards for air quality. Most importantly, the huge amount of air pollutant emissions generated in Asia, especially in China, is expanding every day and spreading to other areas over the world. It wouldn’t take long, global air quality would become poorer and climate would become warmer, if fossil CO2 and air pollutant emissions in Asia cannot be effectively reduced.


Leave a Reply