In New Zealand, air quality is generally quite good in summer and early spring (from December to April), but seems to become poor since late April.
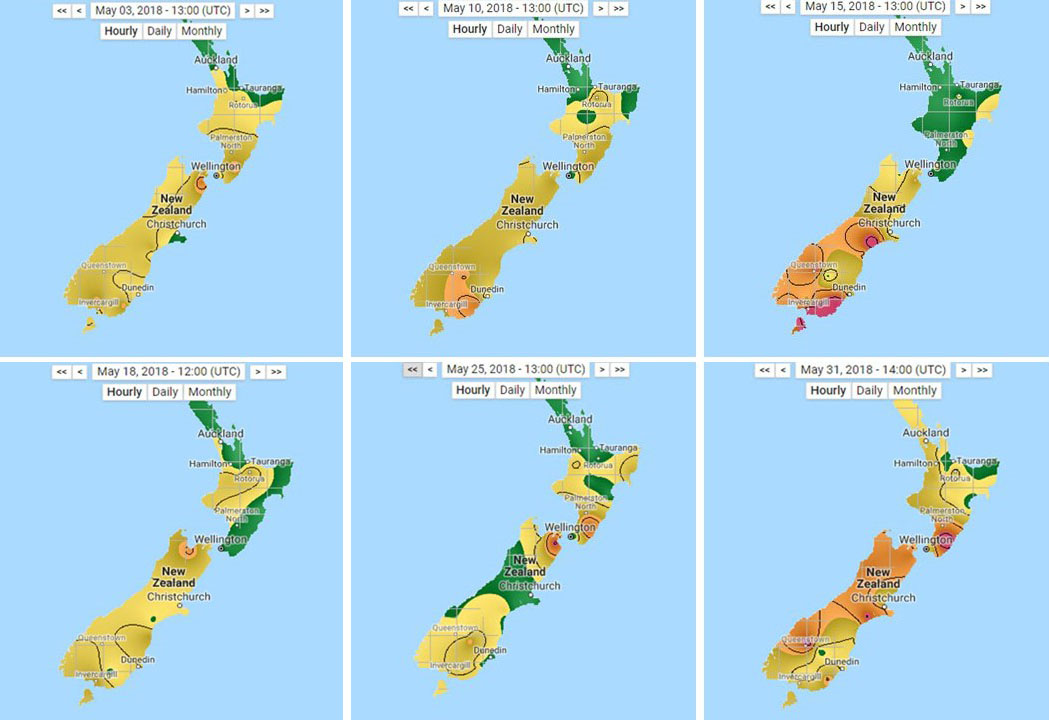
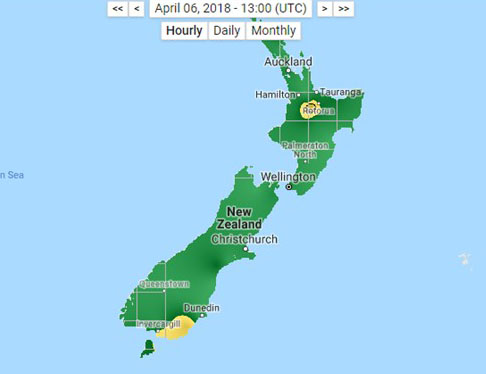
According to the Real-Time Map of Air Pollution, hosted at the Berkeley Earth website, moderate levels of air pollution (Air Quality Index > 50) with a coverage of more than two-thirds of a nation’s land area were evident in New Zealand over 16 days in May 2018. In the last April, this figure was only 5 days, mainly in the end of the month.
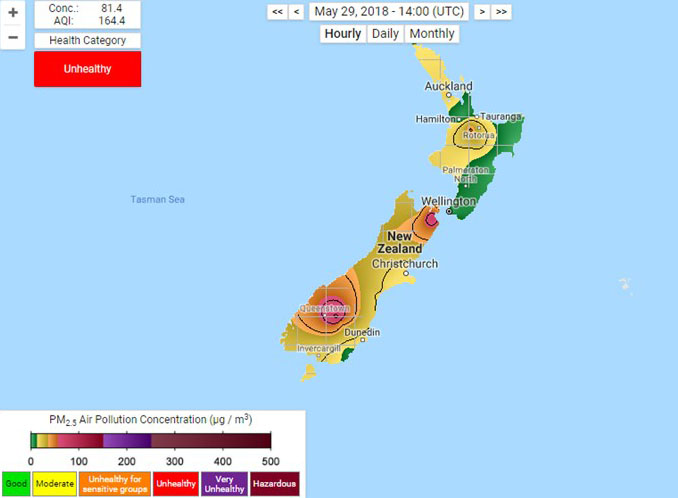
As shown on the map, unhealthy levels of air pollution for sensitive groups (AQI > 100) were also frequently evident in some areas in May 2018. The highest value of AQI in the month was recorded at Queenstown on May 29, 2018, with a number of 164.4. During the month, PM2.5 concentration fluctuated between 20 and 50 μg/m3 in most areas, and was higher than 50 μg/m3 in some areas sometimes, with the highest value of 81.4 μg/m3 at Queenstown on May 29, 2018.
A WHO report published in 2016 suggests that New Zealand has some of the cleanest and safest air on the earth, with an average annual value of only 5 micrograms of PM2.5 per cubic meter of air (5 μg/m3). Compared to this figure, the real-time PM2.5 concentrations recorded in the last month increased substantially, suggesting that air pollution in New Zealand may be worsening.
The WHO report also suggests that all 10 of New Zealand’s most air-polluted cities or towns are in the South Island, with annual means of PM10 ranging between 19 and 28 μg/m3. This was roughly consistent with what was recorded on the Real-Time Map of Air Pollution.
In earlier days of this year, moderate level of air pollution was limited in New Zealand, possibly due to that air pollution emissions were rapidly driven away by brave winds. New Zealand is an island country where sea winds are frequent. Over 170 days a year, as documented in a report, the speed of wind gusts at Wellington is greater than 60 km/h. In late autumn and winter, the winds usually decrease for a period of time.
Compared to industrialized countries, New Zealand has a relatively unique greenhouse gas emissions profile. According to the Ministry for the Environment, agriculture contributed 48.2% of total emissions in New Zealand, and fossil fuels contributed 49.3%. These percentages may vary in different seasons.
Winter is coming in New Zealand, which usually begins on the first day of June and ends on August 31. It may be of interest to continue monitoring air pollution in New Zealand to have a better understanding of seasonal variances of air pollution in the country.
Globally, over 92% of the population are exposed to air pollution to a different extent, as confirmed in another WHO report. Given that New Zealand is one of the countries with the best quality of air in the world, the severity levels of air pollution in the country may help us to have a better understanding of the global air pollution problem.

Leave a Reply