Air pollution is a global problem. According to the World Health Organization, 92% of the global population lives in places where air quality levels exceed WHO limits. Air pollution is causing at least 4.5 million premature deaths each year worldwide.
The real-time Air Quality Index (AQI) has been popularly used to communicate to the public how polluted the air currently is. Since 2007, the World Air Quality Index project team has been providing transparent air quality information every day for more than 70 countries, covering more than 9000 stations in 600 major cities.
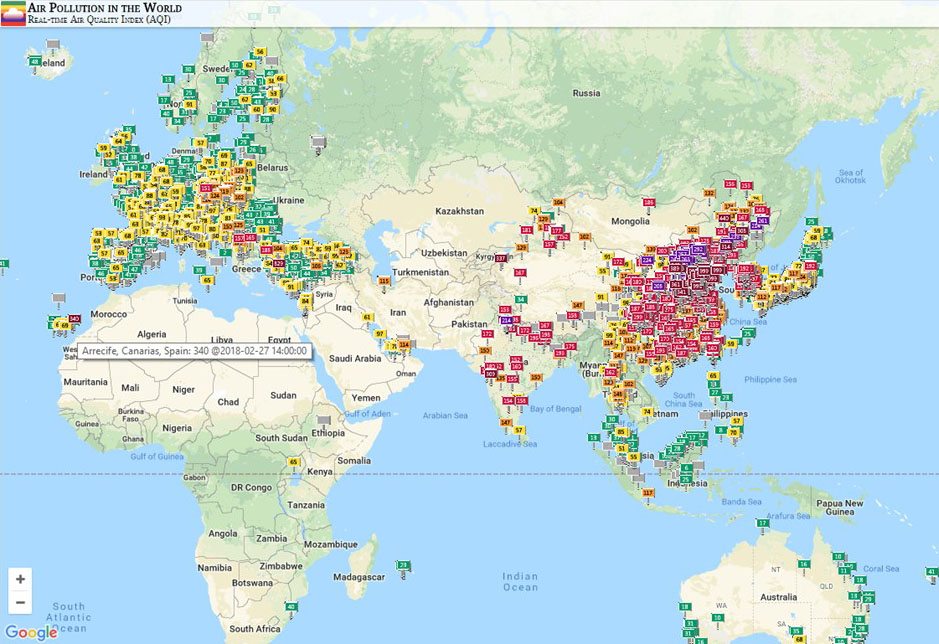
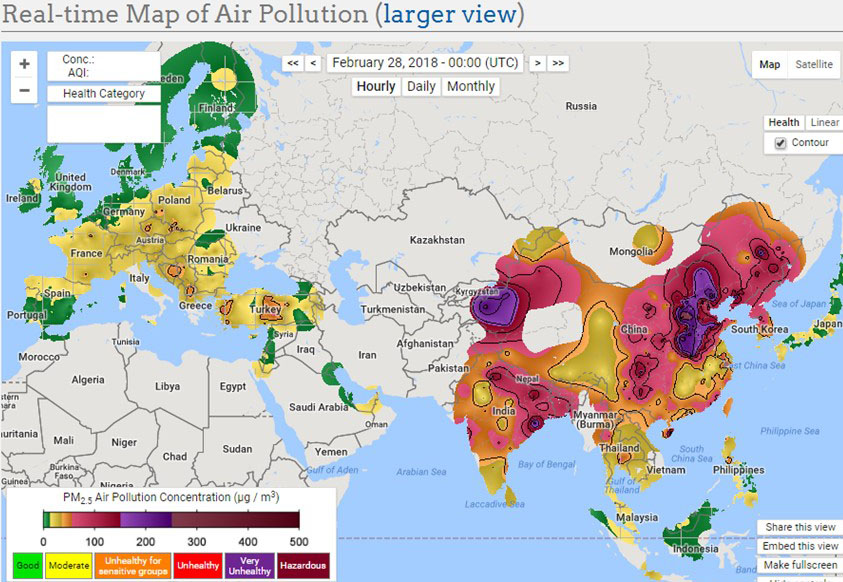
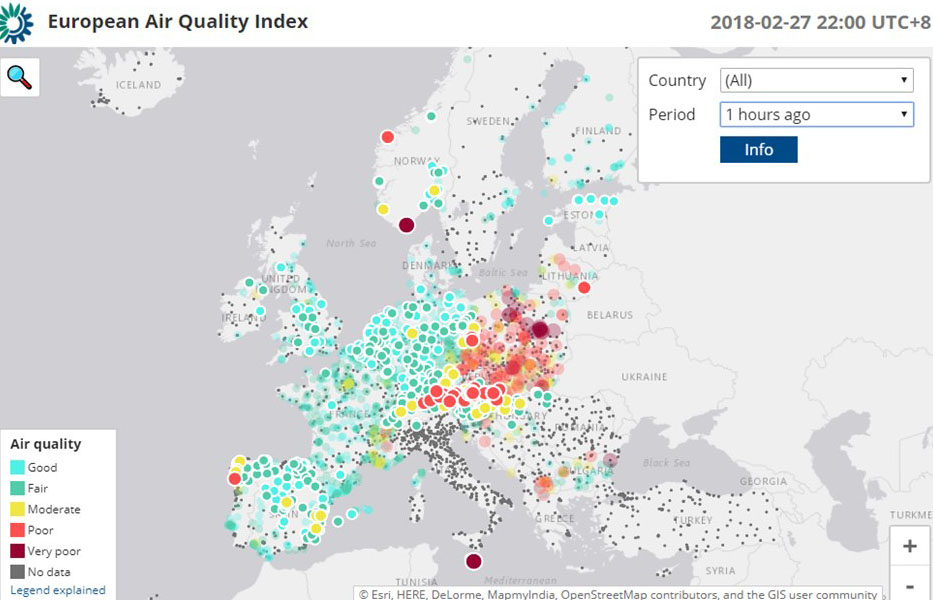
All of the real-time information is visible on the Real-time World AQI Visual Map (Figure 1), which is updated every minute. With the data, a US-based non-profit organization – Berkeley Earth – developed a Real-time Visual Map of Air Pollution (Figure 2), on which the values are replaced with different colors, making the map visually much more impressive. A European AQI Visual Map (Figure 3) has also been developed based on the same data set.
The map provides us with invaluable information, which is not only useful for research and academic purposes but also for promoting public awareness of the coverage and severity of the problem. Before I had a look at the map, I was just aware of the air pollution problem in China and India. When I looked at the map for the first time, I got imagination that air pollution is not only a problem in Asia but also Europe. As I go further, I realize that the coverage and severity of air pollution have been substantially under-demonstrated on the visual map so far. In other words, the Real-time World AQI Visual Map is not complete yet.
A notable feature of the real-time AQI Visual Map may be that relevant data are not available for nearly all countries in Central Asia including Kazakhstan, Kyrgyzstan, Uzbekistan, Turkmenistan, Tajikistan, Afghanistan, and Pakistan, and some countries in Eastern Europe such as Ukraine, Belarus and Russia. Most of these countries were once part of the former Soviet Union or its satellite states. This reminds me of a state of geopolitical tension (called the “Cold War”) after World War II between powers in the Eastern Bloc and powers in the Western Bloc.
Initially, I didn’t realize that air pollution is an environmental problem for these countries. After reading relevant information online, I was surprised that air pollution is also a serious concern in these countries. For example, Pakistan, Afghanistan, and Iran are among the 10 countries with the world’s dirtiest air. Turkmenistan, Tajikistan, Uzbekistan, Kazakhstan, and Iraq are on the list of 10 nations with the most deaths from air pollution. There are reports that air pollution is also a significant environmental problem in Ukraine. Nowadays, air pollution is no longer a problem for each particular country. It is a transboundary, regional, and global public health issue. Online information indicates that assessments of the AQI are also conducted in some of these countries. I sincerely hope that assessments of the AQI can be conducted in all of these countries and that relevant data from these countries can be added onto or connected with the real-time AQI Visual Map soon.
The second feature of the real-time AQI Visual Map may be that there is little information about air quality in offshore areas, such as the East China Sea, South China Sea, Bay of Bengal, Arabian Sea, Black Sea, and Tyrrhenian Sea, and desert or rural areas, including relevant areas in Mongolia, Iran, Saudi Arabia, and Egypt. To estimate the coverage and severity of air pollution, as addressed in my previous post (click here), both the AQI and the range of air pollution are needed. With the available information, the coverage and severity of air pollution in China and the Middle East may be substantially under-demonstrated or under-estimated. For example, relevant reports have indicated that Saudi Arabia, Qatar, Egypt, Cameroon, and the United Arab Emirates are on the list of 10 nations with the highest air pollution and that Egypt, Mongolia, Iraq, and Saudi Arabia are on the list of 10 nations with the most deaths from air pollution. However, AQI information for these areas is limited. Thus, the real-time air quality and the coverage of air pollution in these areas should be monitored. Given the difficulty in collecting related data in desert and offshore areas, a minimum-data strategy may be applied.
In addition, relevant information in Africa and South America seems to be insufficient. I believe that more air-quality information from these areas can be added to the Real-time AQI Map in the future.


Leave a Reply